Since autumn 2024, Ontario has logged a steady string of price declines: the national average sale price sits 3.9 % lower than a year ago (April), while the GTA’s MLS® Home Price Index has slipped almost 4 % in five months. Analysts at TD now warn condo values could finish 2025 15–20 % below their 2023 Q3 peak.
A correction of that scale hurts, but experience shows the real damage often begins after prices fall—when sellers let fear or stubbornness override evidence. Behavioural-finance studies dating back to the early 1990s consistently conclude that cognitive bias, not economic reality, drives a hefty share of costly sell/hold decisions. Understanding those biases is the first step toward avoiding them.
Five Mental Traps That Cloud Judgment
- Loss Aversion: The pain of accepting a paper loss feels twice as heavy as the pleasure of an equivalent gain, so owners cling to yesterday’s price and bleed cash while they wait.
- Anchoring: Last year’s record-high sale on your street becomes the benchmark—even when supply has doubled and mortgage rates have climbed a full point.
- Recency Bias: A single bad month looks like the start of an endless slide; one Bank of Canada hint about rate cuts feels like an instant rescue.
- Confirmation Bias: We click on articles that validate our existing view (“Prices will bounce by summer”) and silently ignore anything gloomier.
- Herd Behaviour: When the investor forum panics, members who never planned to sell suddenly rush to market—or refuse to sell because “nobody else is.”
Left unchecked, those impulses can turn a manageable correction into a personal crisis. The antidote is a repeatable, numbers-first routine that forces you to look past emotions before you price, negotiate, or accept an offer.
Turning Emotion into Analysis: Five Checkpoints
A simple dashboard—updated monthly—can keep you honest:
- Macro Trend: Track the CREA or Teranet index for your region. Three straight monthly declines confirm a real down-trend; three flat months hint at a floor.
- Local Reality: Pull every sold comparable within 500 m over the past 30 days. If your asking price is more than five per cent above that median, re-price before buyers move on.
- Cash-Flow Stress Test: Model a ten-per-cent rent cut, a one-hundred-basis-point rate hike, and two months’ vacancy. If that scenario burns more than half of your cash reserves, waiting for a rebound may cost more than selling now.
- Supply Pressure: Watch months of inventory (MOI). Once MOI tops five in your micro-market, historical data show price declines accelerate.
- Yield Spread: Compare your cap rate to today’s mortgage rate. When the spread turns negative, appreciation—an uncertain outcome—has replaced income as your only upside.
Worksheet download: Pop your numbers into our pre-built Excel file and the five checkpoints calculate automatically. Download Stress-Test Worksheet
A Four-Step Framework for Rational Decision-Making
- Clarify Purpose
Write down why you might sell: liquidity, re-deployment, risk reduction, or another reason. That purpose—not past prices—becomes your anchor. - Triangulate Value
Blend three lenses: fresh comparables, the regional index trend, and discounted cash flow. If two of the three suggest your list price is optimistic, believe them. - Quantify Downside
How long can you carry the property under today’s worst-case cash-flow model? If reserves cover less than twelve months—and MOI keeps rising—the rational choice may be an orderly exit. - Pre-Commit Your Next Move
Decide where proceeds will go before you list. A ready redeployment plan shrinks the fear that fuels loss aversion because you can picture the gain on the other side.
Putting It All Together: Example
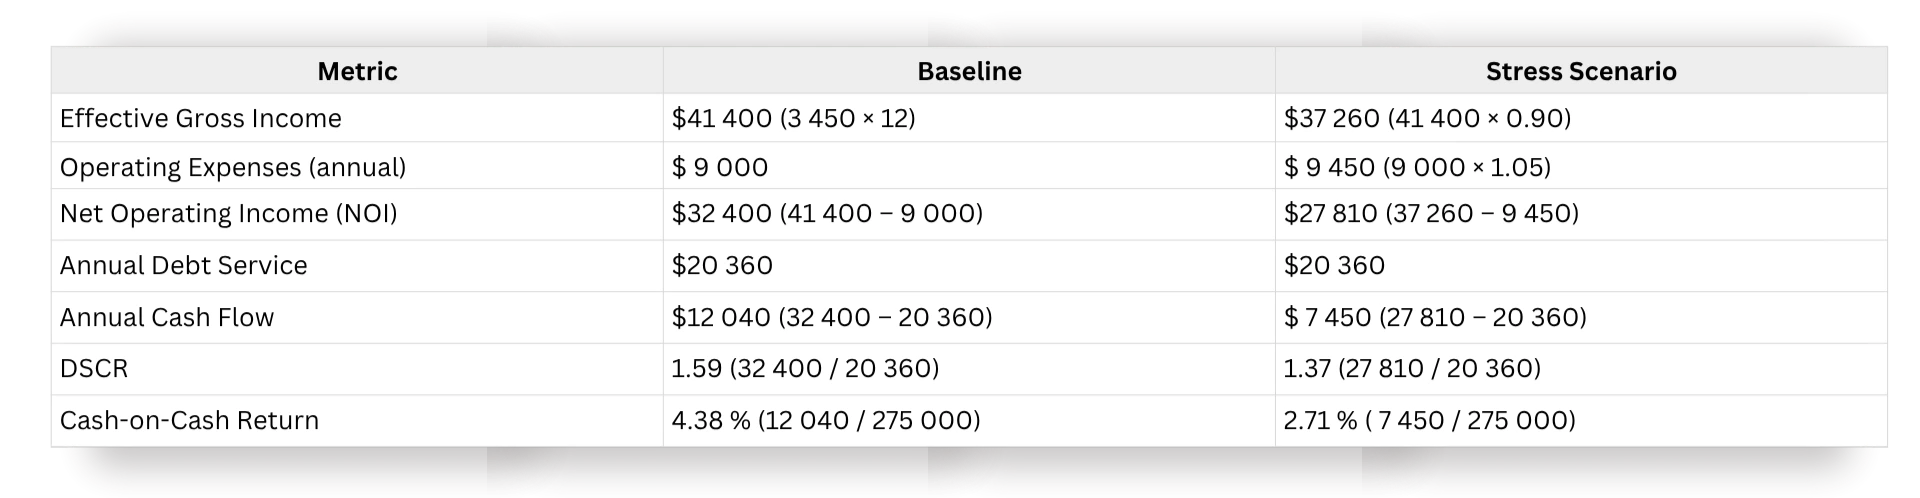
An investor buys a Queen West condo in early 2022 for $780 000, backing it with $275 000 in equity. By mid-2025 its market value softens to $705 000 (LTV ≈ 71.6 %). To gauge downside risk, they run a stress test assuming a 10 % rent decline and 5 % bump in annual operating expenses (no added vacancies or rate shocks):
Key Takeaways
- NOI falls by $4 590/year; cash flow drops from $12 040 to $7 450 (a $4 590 annual loss).
- DSCR weakens from 1.59 to 1.37—still above the 1.25 comfort threshold, but with a much tighter cushion.
- Cash-on-Cash Return slides from 4.38 % to 2.71 %, cutting your yield in half.
Strategic Actions
- Increase reserves to cover at least 6 months of opex (≈ $4 725).
- Refinance or extend the amortization to lower debt service and bolster DSCR.
- Diversify with a higher-yield multiplex to lift overall portfolio stability and returns.
By modeling a 10 % rent drop and 5 % expense inflation in one step, you see exactly how sensitive your deal is—and which levers (reserves, financing, asset mix) you must pull to stay resilient.
Conclusion
Falling prices are uncomfortable; irrational reactions are ruinous. If you can name the bias influencing you, confront it with objective data, and follow a structured plan, you’ll protect both equity and peace of mind—no matter where the cycle goes next.
Feel ready to put a data safety-net under your decisions? Download Stress-Test Worksheet or book a complimentary strategy call with LandLord Realty’s investment team for a bias-proof exit plan tailored to your portfolio.